Loading for Single Cell Analysis Directly from FCS files
[1]:
import os
import numpy as np
import pandas as pd
import matplotlib.pyplot as plt
import seaborn.objects as so

import palmettobug as pbug
The PalmettoBUG package is copyrighted 2024-2025 by the Medical University of South Carolina and licensed under the GPL-3 license.
It is free & open source software, can  be redistributed in compliance with the GPL3 license, and comes with absolutely no warranty.
In python, use palmettobug.print_license() to see the license, or use palmettobug.print_3rd_party_license_info() to print information
about the licenses and copyright of 3rd party software used in PalmettoBUG itself or in the creation of PalmettoBUG.
[2]:
pbug.__version__
[2]:
'0.2.11'
CHANGE The following directory to match an existing directory on your computer if you are testing this tutorial on your own machine!
[3]:
my_computer_path = "C:/Users/Default/Desktop" ## CHANGE This DIRECTORY to match an existing directory on your computer if you testing this tutorial on your own machine!
Create new CyTOF directory, fetch and load example FCS data:
[4]:
new_directory = f"{my_computer_path}/Example_CyTOF"
#pbug.fetch_CyTOF_example(my_computer_path)
Analysis_experiment = pbug.Analysis()
Analysis_experiment.load_data(new_directory + "/main")
Could not load regionprops data, presuming this is a solution-mode dataset -- Spatial analyses will not be possible.
Example Plots:
For a more full example of Single Cell Analysis, including cell clustering, annotaiton & merging, etc. see the Core Pipeline notebooks. This notebook is primarily just showing how to load the example CyTOF data, not with its analysis.
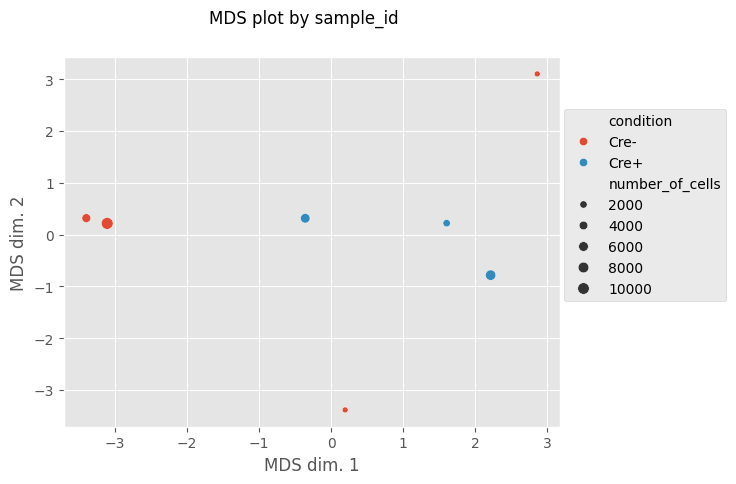
[5]:
fig, MDS_df = Analysis_experiment.plot_MDS(marker_class = "type", color_by = "condition", print_stat = True)
fig
[5]:
[6]:
'''
Since I don't plan on dropping any of the sample_id's I will proceed with the FlowSOM:
'''

Analysis_experiment.do_flowsom(n_clusters = 20, XY_dim = 10, seed = 1234)
C:\Users\benca\miniforge3\envs\main\lib\site-packages\mudata\_core\mudata.py:1531: FutureWarning: From 0.4 .update() will not pull obs/var columns from individual modalities by default anymore. Set mudata.set_options(pull_on_update=False) to adopt the new behaviour, which will become the default. Use new pull_obs/pull_var and push_obs/push_var methods for more flexibility.
  self._update_attr("var", axis=0, join_common=join_common)
C:\Users\benca\miniforge3\envs\main\lib\site-packages\mudata\_core\mudata.py:1429: FutureWarning: From 0.4 .update() will not pull obs/var columns from individual modalities by default anymore. Set mudata.set_options(pull_on_update=False) to adopt the new behaviour, which will become the default. Use new pull_obs/pull_var and push_obs/push_var methods for more flexibility.
  self._update_attr("obs", axis=1, join_common=join_common)
2025-10-23 10:05:39.890 | DEBUG    | flowsom.main:__init__:82 - Reading input.
2025-10-23 10:05:39.921 | DEBUG    | flowsom.main:__init__:84 - Fitting model: clustering and metaclustering.
2025-10-23 10:05:59.193 | DEBUG    | flowsom.main:__init__:86 - Updating derived values.
[6]:
<flowsom.main.FlowSOM at 0x1dfc007e1a0>
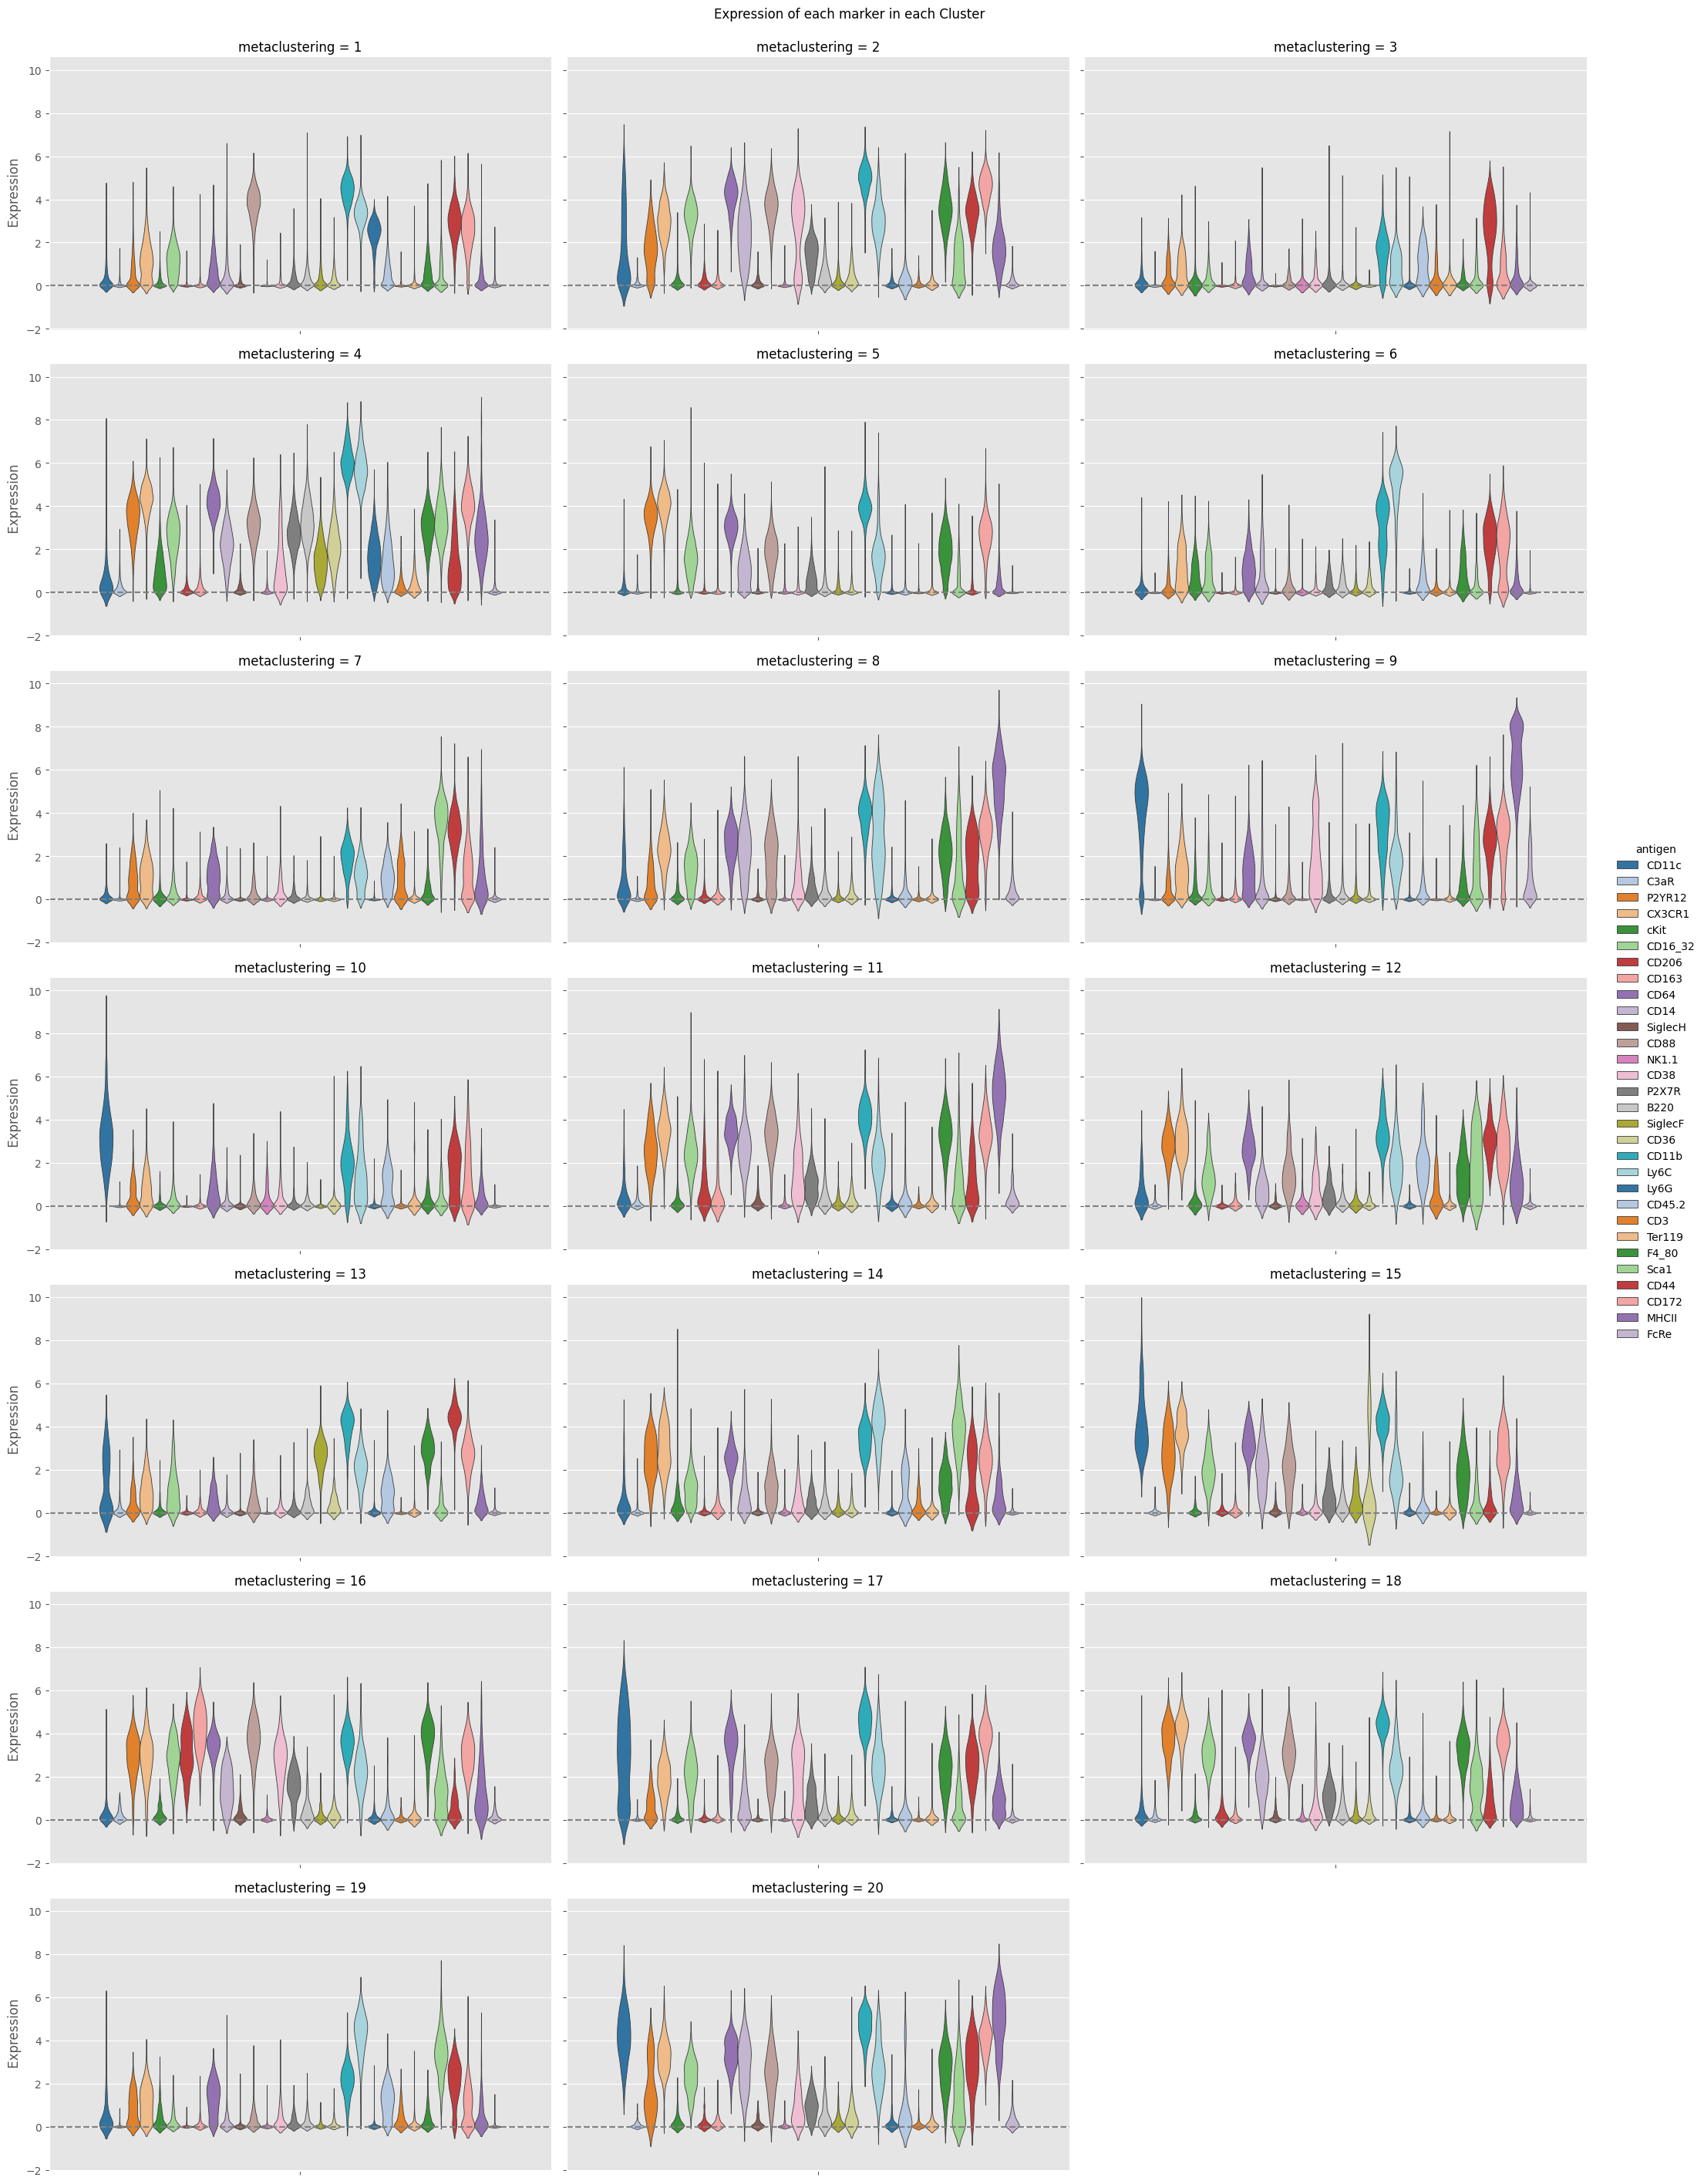
[7]:
fig = Analysis_experiment.plot_cluster_distributions(filename = "violin", groupby_column = "metaclustering", marker_class = 'type',
                                    plot_type = "violin", comp_type = "raw")
fig
[7]:
[8]:
stats_out = Analysis_experiment.do_cluster_stats(groupby_column = "metaclustering", marker_class = 'type')
cluster_to_examine = 2
display(stats_out[cluster_to_examine])   ## or display(Analysis_experiment.df_out_dict[cluster_to_examine])
| F_statistic | p_values | FDR_corrected | Difference in expression mean | st_error | |
|---|---|---|---|---|---|
| CD38 | 29.240000 | 3.021000e-07 | 0.000009 | 1.69000 | 0.226000 |
| CD16_32 | 22.500000 | 5.520000e-06 | 0.000083 | 1.87000 | 0.119600 |
| CD172 | 18.200000 | 3.837000e-05 | 0.000384 | 1.93000 | 0.088160 |
| CD88 | 16.120000 | 1.008000e-04 | 0.000756 | 2.06400 | 0.088990 |
| F4_80 | 15.640000 | 1.263000e-04 | 0.000758 | 1.89200 | 0.076920 |
| CD64 | 13.450000 | 3.573000e-04 | 0.001787 | 1.92700 | 0.068920 |
| CD14 | 12.570000 | 5.482000e-04 | 0.002188 | 1.38500 | 0.251000 |
| CD44 | 12.440000 | 5.835000e-04 | 0.002188 | 1.56500 | 0.080450 |
| CD11b | 8.545000 | 4.098000e-03 | 0.013660 | 1.52200 | 0.060140 |
| P2X7R | 6.455000 | 1.226000e-02 | 0.036780 | 0.66760 | 0.069780 |
| CD45.2 | 2.027000 | 1.570000e-01 | 0.410400 | -0.41310 | 0.112100 |
| CX3CR1 | 1.958000 | 1.641000e-01 | 0.410400 | 0.73880 | 0.071340 |
| SiglecH | 1.507000 | 2.218000e-01 | 0.511800 | 0.05773 | 0.017670 |
| Ly6C | 1.017000 | 3.151000e-01 | 0.675200 | 0.56160 | 0.164700 |
| CD3 | 0.897100 | 3.453000e-01 | 0.690700 | -0.10140 | 0.018800 |
| CD11c | 0.645500 | 4.232000e-01 | 0.755000 | 0.47080 | 0.092380 |
| NK1.1 | 0.632700 | 4.278000e-01 | 0.755000 | -0.07642 | 0.002827 |
| CD163 | 0.502600 | 4.796000e-01 | 0.790400 | -0.25820 | 0.018550 |
| cKit | 0.417500 | 5.194000e-01 | 0.790400 | -0.08395 | 0.029940 |
| CD36 | 0.402400 | 5.270000e-01 | 0.790400 | 0.15290 | 0.103800 |
| SiglecF | 0.292100 | 5.898000e-01 | 0.807800 | -0.12760 | 0.008896 |
| C3aR | 0.288000 | 5.924000e-01 | 0.807800 | 0.01871 | 0.010550 |
| B220 | 0.211300 | 6.465000e-01 | 0.817800 | 0.12920 | 0.068780 |
| Ly6G | 0.201500 | 6.543000e-01 | 0.817800 | -0.10170 | 0.030880 |
| Sca1 | 0.127000 | 7.222000e-01 | 0.866600 | -0.18390 | 0.119700 |
| FcRe | 0.057040 | 8.116000e-01 | 0.901700 | 0.02186 | 0.007885 |
| CD206 | 0.043890 | 8.344000e-01 | 0.901700 | -0.05817 | 0.012400 |
| Ter119 | 0.032830 | 8.565000e-01 | 0.901700 | -0.01531 | 0.018390 |
| P2YR12 | 0.026200 | 8.717000e-01 | 0.901700 | 0.08172 | 0.077800 |
| MHCII | 0.000365 | 9.848000e-01 | 0.984800 | 0.01533 | 0.073370 |
[9]:
Analysis_experiment.do_UMAP(marker_class = "type", cell_number = 1000, seed = 0)
C:\Users\benca\miniforge3\envs\main\lib\site-packages\tqdm\auto.py:21: TqdmWarning: IProgress not found. Please update jupyter and ipywidgets. See https://ipywidgets.readthedocs.io/en/stable/user_install.html
  from .autonotebook import tqdm as notebook_tqdm
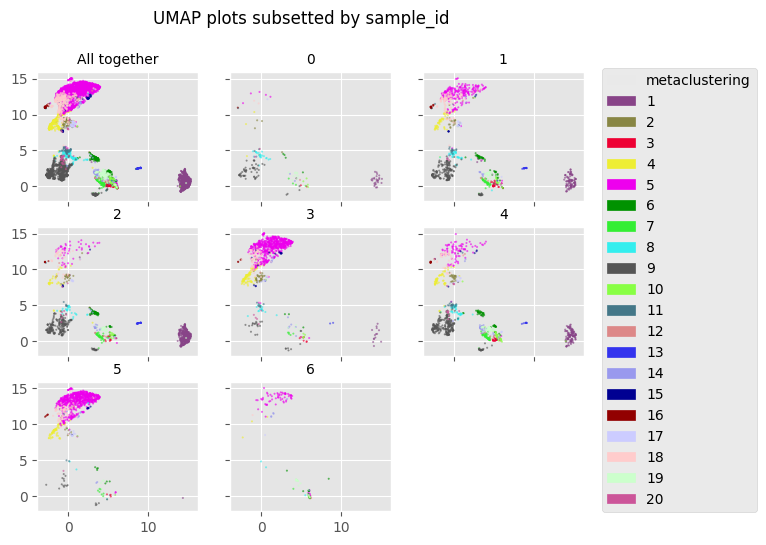
[10]:
fig = Analysis_experiment.plot_facetted_DR(filename = "facetted_umap", color_by = "metaclustering", subsetting_column = "sample_id",
                                    number_of_columns = 3, color_bank = None, kind = "UMAP")
fig
[10]:
[11]:
## export:
'''NOTE! This export is taken up by the CSV_load example notebook!'''

include_marker_class_row = True     ## use this when re-importing into PalmettoBUG, otherwise leave False if importing into another software
Analysis_experiment.export_data(include_marker_class_row = include_marker_class_row, filename = 'export')
[11]:
| antigen | BCKG190Di | Ba138Di | CD11c | B1 | B2 | B3 | Ce140Di | Cs133Di | C3aR | P2YR12 | ... | Time | index | sample_id | file_name | patient_id | condition | clustering | metaclustering | scaling | masks_folder |
|---|---|---|---|---|---|---|---|---|---|---|---|---|---|---|---|---|---|---|---|---|---|
| 0 | 0.0 | 3.895608 | 0.248565 | 3.405578 | 3.067043 | 3.066973 | 0.0 | 0.0 | 0.592824 | 4.325124 | ... | 3.796436 | 0 | 0 | Barcode #8.fcs | na | Cre- | 61 | 18 | unscale | None |
| 1 | 0.0 | 3.681421 | 0.355128 | 2.147621 | 2.447138 | 2.135874 | 0.0 | 0.0 | 0.051988 | 0.0 | ... | 8.70974 | 1 | 0 | Barcode #8.fcs | na | Cre- | 67 | 3 | unscale | None |
| 2 | 0.0 | 4.042782 | 4.506316 | 2.4991 | 2.652415 | 2.560925 | 0.120025 | 0.0 | 0.0 | 0.243994 | ... | 9.746684 | 2 | 0 | Barcode #8.fcs | na | Cre- | 99 | 9 | unscale | None |
| 3 | 0.0 | 0.0 | 6.405453 | 2.196801 | 5.333436 | 2.047101 | 1.576287 | 0.0 | 0.0 | 0.0 | ... | 10.659575 | 3 | 0 | Barcode #8.fcs | na | Cre- | 87 | 10 | unscale | None |
| 4 | 0.0 | 4.247361 | 0.0 | 2.896898 | 3.088958 | 2.276405 | 0.0 | 0.0 | 0.0 | 0.968739 | ... | 10.895327 | 4 | 0 | Barcode #8.fcs | na | Cre- | 38 | 6 | unscale | None |
| ... | ... | ... | ... | ... | ... | ... | ... | ... | ... | ... | ... | ... | ... | ... | ... | ... | ... | ... | ... | ... | ... |
| 31158 | 0.119976 | 5.902887 | 0.211383 | 1.178466 | 1.317018 | 0.753613 | 0.256526 | 0.0 | 0.0 | 2.171962 | ... | 14.733731 | 31158 | 6 | Barcode #12.fcs | na | Cre- | 53 | 18 | unscale | None |
| 31159 | 0.0 | 5.650714 | 0.0 | 0.0 | 0.0 | 0.0 | 0.0 | 0.077194 | 0.0 | 0.048049 | ... | 14.756608 | 31159 | 6 | Barcode #12.fcs | na | Cre- | 39 | 6 | unscale | None |
| 31160 | 0.0 | 4.884189 | 0.0 | 1.360009 | 0.712095 | 0.597875 | 0.0 | 0.0 | 0.0 | 3.869649 | ... | 14.762814 | 31160 | 6 | Barcode #12.fcs | na | Cre- | 4 | 5 | unscale | None |
| 31161 | 0.615399 | 5.610257 | 0.0 | 1.344239 | 0.0 | 0.19547 | 0.0 | 0.0 | 0.146257 | 3.092133 | ... | 14.765406 | 31161 | 6 | Barcode #12.fcs | na | Cre- | 34 | 5 | unscale | None |
| marker_class | 0 | 0 | 1 | 0 | 0 | 0 | 0 | 0 | 1 | 1 | ... | 0 | na | na | na | na | na | na | na | na | na |
31163 rows × 57 columns
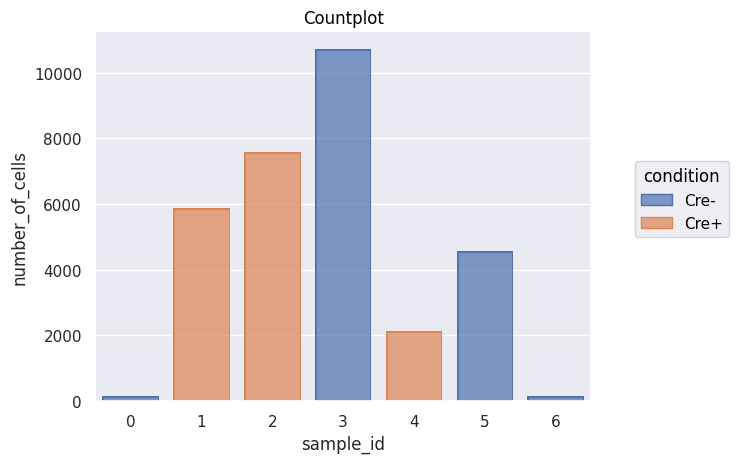
[12]:
Analysis_experiment.plot_cell_counts()
[12]:
[13]:
Analysis_experiment.metadata
[13]:
| file_name | sample_id | patient_id | condition | number_of_cells | |
|---|---|---|---|---|---|
| 0 | Barcode #8.fcs | 0 | na | Cre- | 155 |
| 1 | Barcode #1.fcs | 1 | na | Cre+ | 5875 |
| 2 | Barcode #5.fcs | 2 | na | Cre+ | 7572 |
| 3 | Barcode #11.fcs | 3 | na | Cre- | 10721 |
| 4 | Barcode #3.fcs | 4 | na | Cre+ | 2134 |
| 5 | Barcode #10.fcs | 5 | na | Cre- | 4558 |
| 6 | Barcode #12.fcs | 6 | na | Cre- | 147 |
[14]:
Analysis_experiment.data.obs[Analysis_experiment.data.obs['sample_id'] == '4']
[14]:
| sample_id | file_name | patient_id | condition | clustering | metaclustering | |
|---|---|---|---|---|---|---|
| 24323 | 4 | Barcode #3.fcs | na | Cre+ | 71 | 18 |
| 24324 | 4 | Barcode #3.fcs | na | Cre+ | 40 | 5 |
| 24325 | 4 | Barcode #3.fcs | na | Cre+ | 64 | 2 |
| 24326 | 4 | Barcode #3.fcs | na | Cre+ | 41 | 5 |
| 24327 | 4 | Barcode #3.fcs | na | Cre+ | 89 | 9 |
| ... | ... | ... | ... | ... | ... | ... |
| 26452 | 4 | Barcode #3.fcs | na | Cre+ | 8 | 1 |
| 26453 | 4 | Barcode #3.fcs | na | Cre+ | 87 | 10 |
| 26454 | 4 | Barcode #3.fcs | na | Cre+ | 98 | 9 |
| 26455 | 4 | Barcode #3.fcs | na | Cre+ | 98 | 9 |
| 26456 | 4 | Barcode #3.fcs | na | Cre+ | 98 | 9 |
2134 rows × 6 columns
[ ]: